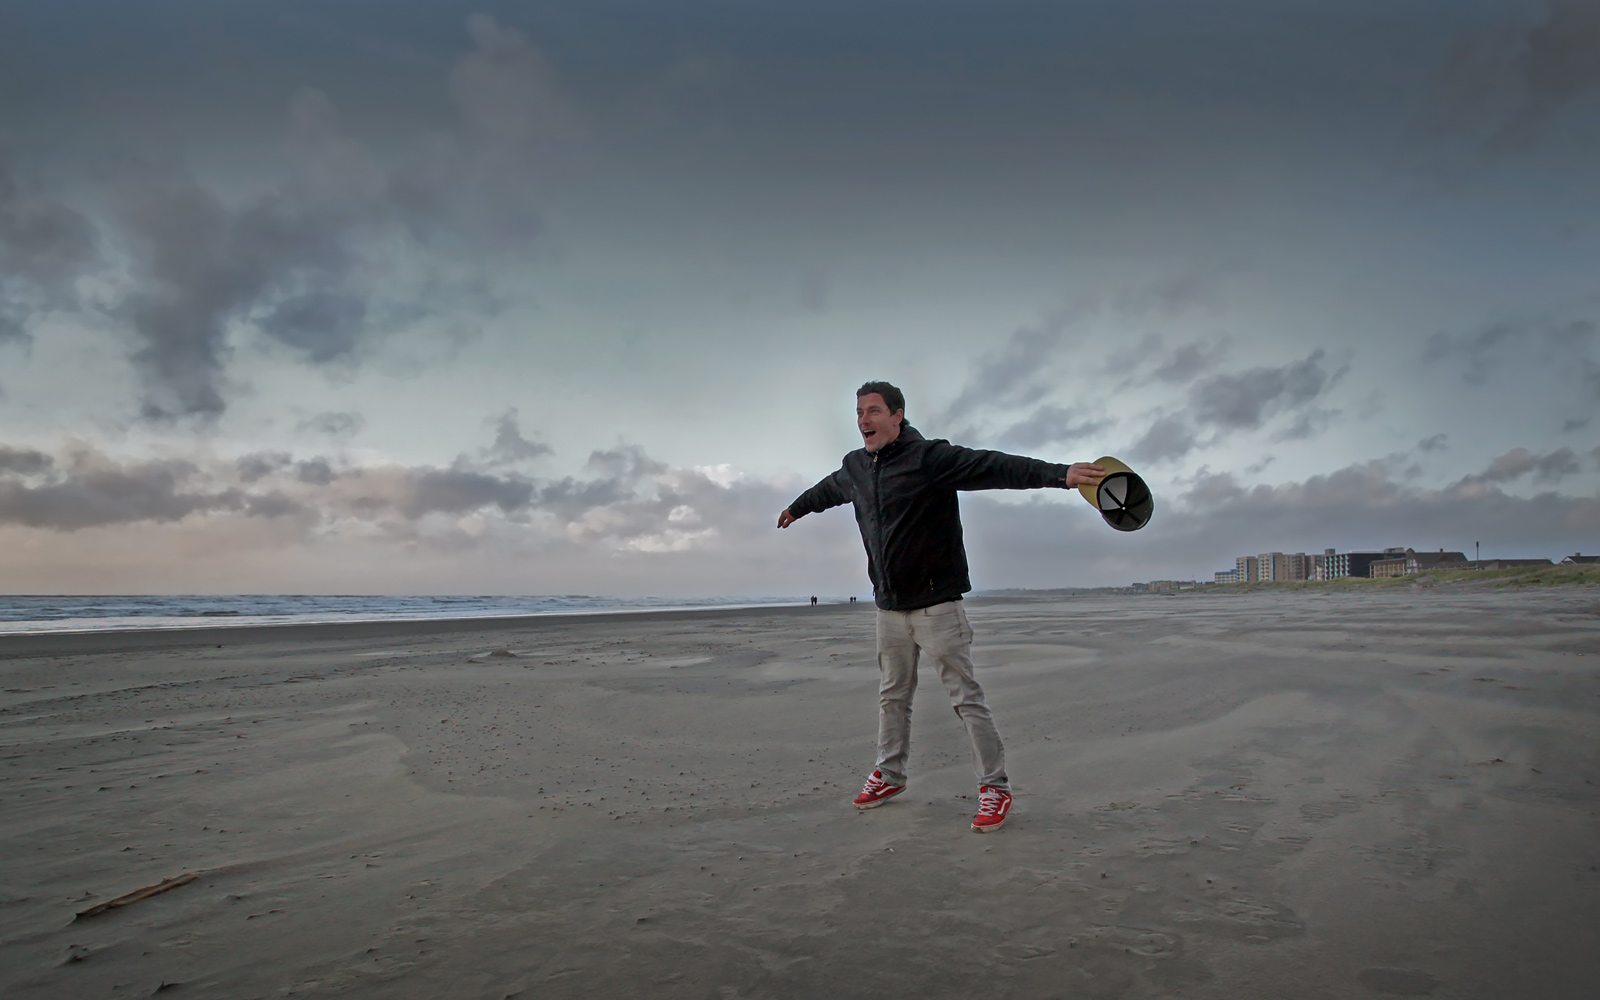
If your winter beach vacations to date have required sunscreen, then you clearly have not experienced a magical Seaside day in January or February, when the weather can change from bright sunshine to misty drizzle in mere hours.
These unpredictable cooler days have perks: There’s something quite satisfying about playing board games and sipping hot chocolate next to a fire in a coastal cottage, waiting for the rain to let up before heading out to explore the shore. And locals will tell you that the best time for beachcombing is low tide after a good storm.
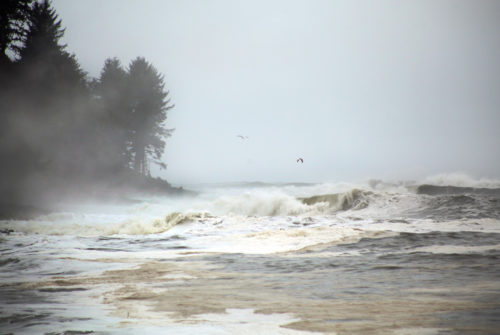
Storm-watchers and tide-observers come to Seaside, standing on the Prom to see the beach transform in the matter of minutes: Storms tend to steal the show, demonstrating the dynamic force of nature present on the Coast. Another ocean phenomenon, “king tides” — defined as unusually high tides — highlight the influence tides have on coastal environments and how climate change can dramatically affect them. King tides occur when the moon is nearest the earth in early winter. Check out the photo contest to see images from this past winter’s event.
Whether you come to Seaside for storms, to watch the tides or to paddle tidally influenced rivers, it’s crucial that you understand when low and high tide occurs since they affect almost everything you’ll do here (including simply lazing on the shore).
Learning to read tide tables can help in planning your day. You can find up-to-date tables specifically for Seaside here. If you’re new to tide tables, here are six pro tips for reading them properly:
How to Read Tide Tables
1. Find the date.
After selecting the tide table for the appropriate month, scan the left side of the table for the date in question.
2. Scan for time of day.
As you move across the chart left to right, you’ll see times of day and height measurements in feet.
3. Understand “chart datum.”
The measurements represent how many feet above or below chart datum the tide will be at that given time. Chart datum is the plane of reference against which tidal heights are measured; it’s an average of low tide heights.
4. Check high tide.
High tides (H) are the larger, positive numbers. For example, H 8.0 would indicate that the peak swell for that time period will be 8 feet above chart datum (or the average low tide height).
5. Check low tide.
Low tides (L) are the smaller numbers and can be either positive or negative. For example, L -1.0 indicates a low tide at one foot below chart datum. For the best beachcombing, you want to look for low tide — strong minus tides can be especially good beach days
6. Observe tidal rhythms.
On the Oregon Coast, you’ll typically see two high tides and two low tides per day, roughly six hours apart.
7. Ask to be sure.
If you aren’t sure about tides or have questions, ask a local or make an inquiry with the Seaside Visitors Bureau staff, who can give you in-person guidance as well as more travel tips.
